More Visuals: Picture Your Strategic Plan
Your team has a strategic plan. Now how do you make sure it’s front of mind (and easy to comprehend) for the people implementing it? Creating a one-page infographic chart of your plan is one solution.
In this third installment in our series on the power of visuals, we’ll dive deeper into using visuals specifically for strategic planning. The real challenge is not creating the infographic chart; it’s making sure your strategic plan has all the right elements to keep you focused. First, let’s consider why a visual representation of your strategic plan is worth the effort.
Why Is A Visual Strategic Plan Good?
- Clarity. Creating a visual map of your strategic plan offers another way to ensure your plan makes sense. I was surprised by how many questions I had about Leslie’s and my blog marketing plan when I was translating it into a visual. It’s better to clarify your plan sooner rather than later.
- Quick reference. Your chart is basically a cheat-sheet to your plan; it’s everything you need to know in one easy-to-print 8 1/2 by 11 inch sheet of standard letter-size paper. Making it easy to print makes it more useful — you can pin it on your bulletin board or keep it in a project folder for quick reference.
- Easy to show relationships. A written strategic plan with hierarchical numbering can be daunting to read with its jumble of numbers, letters, and roman numerals. It’s often more difficult to show the various connections among the goals, objectives, strategies and tactics.
Leslie and I were impressed with Ben McConnell’s one-page strategic plan infographic on the Church of the Customer Blog (http://www.churchofcustomer.com/2009/12/how-to-create-a-1page-strategic-plan.html). It inspired us to create a strategic plan infographic for Your Life@Work so we could try out this visualization technique (see below). For simplicity’s sake, our chart has only one objective and one strategy for each goal.
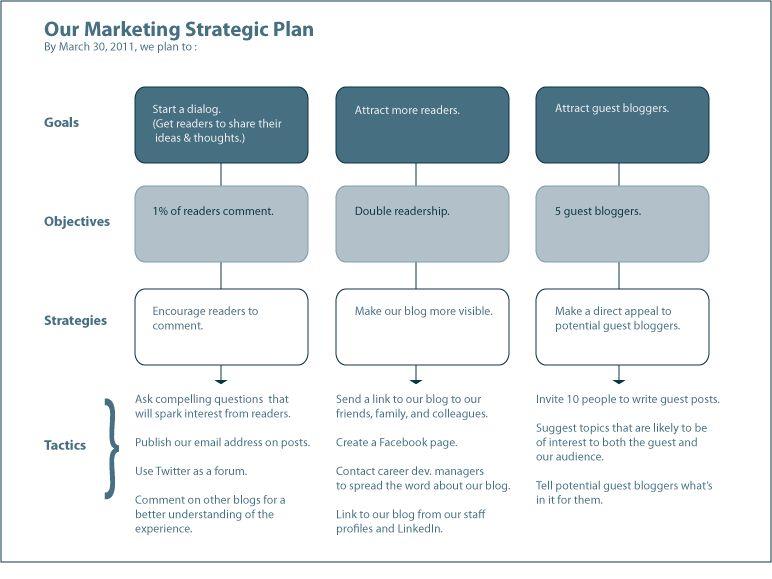
Here’s how to build your own chart:
- First row: Goals. List your top goals for the period — no more than five goals and three is better — across the top of the page (e.g., “Attract more readers”).
- Second row: Objectives. Position your objectives under the first row to match them with the appropriate goal (“1% of readers comment”).
- Third row: Strategies. Detail the strategies you’ll use to reach those objectives (“Encourage readers to comment”).
- Fourth row: Tactics. List your tactics to implement those strategies (“Publish our email address on our posts”).
- Draw arrows to connect everything (e.g., match objectives to their goal and strategies with their objectives).
Finally, don’t let your lack of Adobe Illustrator or other specialized design software stop you. Many commonly-available software packages have easy-to-use drawing tools including Microsoft Word and PowerPoint. Moreover, a simple hand-drawn chart is just as effective — and it might even be more compelling.
Goals vs. Objectives and Strategies vs. Tactics – What’s The Difference?
You may have noticed that our marketing plan chart (above) has goals at the top while the Church of the Customer example has objectives at the top. Your plan will not implode if you call a goal an objective or vice versa. The important point is to have a desired outcome that you are seeking and to outline the progressive steps that will get you there. Before you get started, reach an agreement with your team about which terms you will use and how you will define them — it’s vital to your plan.
Do I Really Need All Four?
Our impulse is often to set a goal and jump right to tactics (the detailed “how” part of executing the plan). So? We miss the chance to consider several possible strategies; more importantly, we neglect to state a measurable objective (asking “what does success look like” to develop a desired outcome.) For more on defining desired outcomes, see our post on Envisioning Successful Outcomes. Bottom line: You will have a stronger plan if you cover all four bases — goals, objectives, strategies, and tactics.
“Setting a goal is not the main thing. It is deciding how you will go about achieving it and staying with that plan.” — Tom Landry
Now, It’s Your Turn
1. Find out more about Ben McConnell’s Church of the Customer one-page strategic plan infographic (link above) and read his previous post on defining goal, objective, strategy, and tactic and why it’s importantto agree what they mean (https://churchofcustomer.com/2009/12/objectives-goals-strategies-tactics.html).
2. If you have a strategic plan, turn it into a visual infographic (see instructions above) and share it with your team.
3. Read this brief article on strategy vs. tactics from BrandInsightBlog.
4. For more tips on using visuals, see our previous posts: Use the Power of Visuals to Get Your Point Across and Going Beyond Pie Charts: More Ways to Use Visuals.